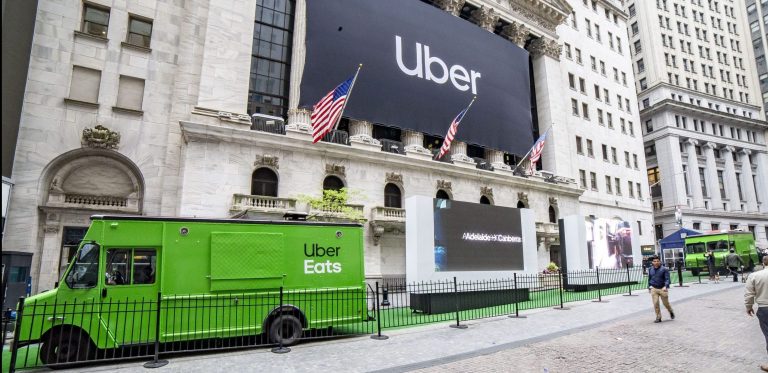
Do free samples increase sales? Yes, and the brands that can prove it are the ones that measured the activation from the first unit handed out to the retailer’s velocity report four weeks later. The ones that cannot prove it have a photo. This guide is the measurement layer for the whole sampling cluster: the funnel (units distributed, contacts captured, redemptions, retail velocity lift, earned media value), benchmarks from real Food Truck Promotions activations, what the published research says about sampling and purchase, a cost per trial calculation you can run on a napkin, and a one-page reporting template. It does not re-explain the formats; product sampling marketing does that.
Key Takeaways
- Samples increase sales when the trial resembles use and the hand-off ends at a store. A mini plus a coupon converts; a sachet dropped in a bag does not.
- Five numbers make the funnel: units distributed, contacts captured, redemptions, velocity lift in activated stores, and earned media value. Report all five or the activation is unmeasured.
- Benchmarks from real activations: 25 to 40 percent capture rate at a consultation counter, 8 to 15 percent redemption at four weeks, and a cost per trial of $15 to $35 on a single-market program.
- Cost per trial is the number to carry: program cost divided by units distributed, compared against the full-size price and the margin.
- The report is due two weeks after the activation with a 30-day follow-up for redemptions and velocity. Later than that and nobody reads it.
Do Free Samples Increase Sales? What the Research Says
The published evidence is consistent. Sampling moves purchase because it removes the risk of trying something new, creates a small sense of obligation (people who accept something free are more likely to reciprocate) and, for consumables and beauty, lets taste and texture make the argument. The strength of the effect depends on the product and the format.
A few references worth citing in a deck. HubSpot’s guide to sampling marketing summarizes the trial-to-purchase case and the formats. Bazaarvoice’s research on product sampling reports that sampled consumers are substantially more likely to purchase and to leave reviews, which matters for products that live or die on ratings. Shopify’s overview of product sampling covers the economics for DTC brands. The consistent finding across them: sampling lifts purchase meaningfully in the weeks after trial, with the biggest lifts in food, beverage and beauty, and the lift decays unless the sample comes with a path to buy.
The caveats matter too. The effect is smaller when the sample does not resemble use (one sachet of a 30-day product), when there is no retailer or link to buy, and when the brand samples people who were never going to be customers (a hangover-cure sample at a children’s event). Measurement is how you find out which of those happened.
The Product Sampling Funnel
Five numbers, in order. Each one is the denominator for the next.
1. Units distributed. The count of samples handed out, by tally, per hour. Not an estimate. This is the denominator for everything else, and a program that guesses it cannot report a rate.
2. Contacts captured. Sign-ups, scans, texts, badge scans, whatever the mechanic was. Expressed as a capture rate: contacts divided by units.
3. Redemptions. Uses of a code, coupon or link that only existed at the activation, tracked at two and four weeks. Expressed as a redemption rate against units and against contacts.
4. Retail velocity lift. Units sold per store per week in the activated stores versus a control set, over the four weeks after the activation, from the retailer’s data where the retailer shares it. This is the number the buyer cares about.
5. Earned media value and reach. Impressions and engagement from the brand’s and attendees’ content, press mentions, and a dollar value for the equivalent paid media. It is real, it is usually the biggest number, and it should never be the only one.
Cost per trial sits underneath: program cost divided by units distributed. Cost per contact and cost per redemption follow from it.
Benchmarks From Real Activations
Ranges below come from Food Truck Promotions sampling programs across beauty, food and beverage and CPG. They are the ranges a brand should expect from a well-run single-market activation; a tour spreads the build cost and lowers the per-unit figures.
| Metric | Typical range | Notes |
|---|
| Units distributed per day | 600 to 1,200 at a counter; 2,000 to 4,000 at a festival gate | Set by format and dwell |
| Capture rate | 25 to 40 percent at a consultation counter; 10 to 20 percent at volume | One-handed mechanics at volume |
| Redemption rate at four weeks | 8 to 15 percent of units | Higher with a store-specific coupon and a retailer within sight |
| Velocity lift in activated stores | 20 to 60 percent over control for four weeks | Where the retailer shares data |
| Cost per trial | $15 to $35 single market; $10 to $25 on a tour | Program cost / units |
| Cost per contact | $50 to $120 | Program cost / contacts |
Two real figures for scale. Fever-Tree’s Espresso Martini Bar produced 5,100+ trials and 3,400 take-home items, 70 percent over goal, with a cost per trial well inside the mixer’s margin. innisfree’s West Coast tour produced 3,000+ visitors and 1M+ impressions with a consultation format, which is the lower-volume, higher-capture end of the range.
How to Calculate Cost Per Trial
Program cost divided by units distributed. Then compare it to the product.
A worked example. A skincare sampling program costs $110,000 for two days and distributes 2,400 deluxe minis. Cost per trial: $46. Full-size price $68, gross margin 70 percent, so each conversion is worth about $48 in margin on the first purchase. At a 12 percent redemption rate (288 purchases) the first-purchase margin is about $13,800, which does not cover the program on first purchase alone. At a 40 percent repeat rate and three purchases a year, lifetime margin per converted customer is closer to $190, and the program pays back at about 580 conversions, or 24 percent of units.
That is the honest math for a single-market, two-day program: it pays back on repeat purchase and on the retailer lift, not on day one. The same build on a four-city tour distributing 9,000 minis at $265,000 has a cost per trial of $29, which pays back at a lower conversion rate. This is why cost per trial, not program cost, is the number to carry into the next budget conversation, and why the multi-city economics matter.
Three things that lower cost per trial without lowering quality: a tour (fixed build cost spread across cities), private property (no city permit fee or wait), and a format matched to the product (a consultation for skincare, volume for a beverage).
Setting Up Measurement Before the Activation
Measurement that is designed on the day does not happen. Five things to set up in week one of the program.
- A tally system for units. A clicker per station, logged hourly by the captain. Or pre-counted lots per hour.
- A capture mechanic that produces a record. A QR to a landing page with a UTM, an SMS keyword, a tap card, a badge scanner. The record lands in the brand’s CRM, not a spreadsheet on someone’s laptop.
- A code that only exists at the activation. Store-specific if there is a retailer, with a city suffix on a tour, so redemptions are attributable.
- A control set with the retailer. Agree before the activation which stores are activated and which are control, and who pulls the velocity report at four weeks.
- A photo and content brief. Who shoots, what the hero shot is, which handle posts, so EMV can be calculated from real posts.
The pop-up shop measurement guide covers the non-sampling metrics (dwell, foot traffic, sales on site) that apply when the activation sells as well as samples.
The One-Page Report Template
Due two weeks after the activation, with a 30-day addendum for redemptions and velocity.
Header. Brand, product, format, vehicle, cities and dates, program cost.
The funnel. Units distributed (by day and by city), contacts captured and capture rate, redemptions at two weeks and the projected four-week rate, velocity lift where available, EMV and reach.
Cost metrics. Cost per trial, cost per contact, cost per redemption.
Comparison. Against the brief’s targets, against the last comparable activation, and city by city on a tour.
What worked and what did not. Three bullets each, from the captain’s notes: the hour the line was longest, the sample that ran out, the question people asked most.
Recommendation. The next market, the next format, or the next retailer conversation, with the number that supports it.
Appendix. Photos, the temperature log, the permit record, the raw tally sheets.
A report longer than a page plus an appendix is not read. A report later than two weeks is not read either.
Common Measurement Mistakes
Reporting impressions as the result. Impressions are the byproduct. Units, contacts and redemptions are the result.
Estimating units. “About 3,000” is not a denominator. Count.
A generic coupon code. If the code also ran in an email, the redemption cannot be attributed to the activation.
No control stores. A velocity lift without a control set is a seasonal chart.
Measuring at day one only. Redemptions and velocity happen over four weeks. Report at two weeks, update at thirty days.
Swapping the crew on a tour. Different people, different capture discipline, different numbers, no comparison. See the mobile product sampling tours guide.
Case Study: Fever-Tree Espresso Martini Bar